The performance of your WordPress website is always an important consideration. Slow page speeds often result in lower conversion rates and a frustrating experience for your site visitors. There are many reasons your website might load slowly, perhaps it has a high number of site visitors, or is running an ecommerce platform, or a lot of plugins, or maybe it’s just been around for a while so there can be any number of factors as to why you are experiencing poor performance. How do you find out what’s making your site slow?
One of our favourite tools to use is New Relic’s Application Performance Monitoring. Let’s take a look at some case studies to see how we’ve been able to find major performance issues on some of our clients’ websites.
Application Performance Monitoring (APM) is a tool keeps an eye on all parts of your websites performance. The level of detail can be overwhelming when first looking under the hood – where do I start! The data is impressive, showing us details of what plugins and even which function calls are taking the most time to perform, and those which occur the most frequently. We can also monitor the database to see which operations are the most time consuming.
APM offers graphic representations of data that makes it easy to spot issues and easy to convey this information to our clients. Here’s some of what we’ve found…
New Relic APM – Case Study 1
In our first case study our client is a large international luggage blog with over 1,000 unique site visits per day. The site was built sometime ago and whilst well maintained there was something impacting performance. Using APM we were able to find a redirect plugin was hitting our response time – peaking at over 20 seconds and averaging around 5 to 10 seconds.
The graph below shows before and after disabling the plugin. The high number of site visits meant that we were redirecting visitors 24/7. Easy to clean up and a reminder that redirects shouldn’t be done via a plugin. When using a plugin the server has to load enough WordPress to get to the redirect function in the page headers. Placing redirects on the server means we don’t load any WordPress content before redirecting.

New Relic APM – Case Study 2
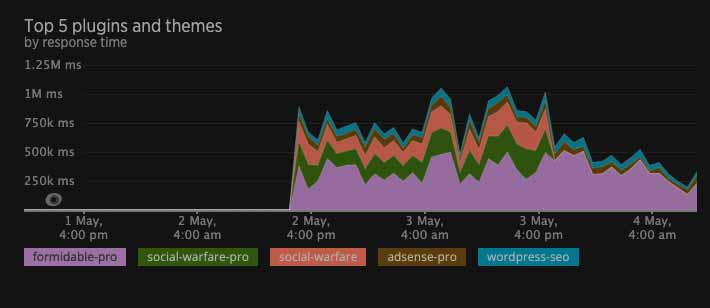
The second case study is a site with a comparable number of visits but with more than 16,000 posts, each with a number of hi-res images. The site is heavily dependent on a moderately complex search query so performance is absolutely critical. This time we moved the site to our servers with APM activated. As soon as we did we could see a large amount of resources being used by a seemingly innocuous social media share plugin. The issue was that every time a post was being loaded the share plugin was loading with it. The social share plugin had almost as high of a response time as the search query itself! This is what it looked like:

New Relic APM – Case Study 3
Case study is the most recent. This is on a large Australian education website, serving resources to teachers and parents. The website is quite complex with a lot of activity including integrations with marketing tools and a plugin that links in with the companies warehouse for distributing purchases. We found this plugin had a significantly higher response time than exp. In the three hours before we deactivated the plugin we can see a dozen times that the response time hit 60 seconds and peaked a few times at 80 seconds! You can imagine how that works for sales!
There was quite a satisfying outcome for this case study – contacting the developers they informed us that they were aware of this and had released a new plugin. With their support we upgraded the plugin and improved site performance on the server and front end (in the browser) as well.


New Relic APM – Case Study 4
WordPress performance case study four is a smaller site with less traffic than the previous examples. This one came to our attention by being the site with highest payload of all sites on the server. Certainly an anomaly was ready to be found. A quick look and we could see that there was a licensing plugin adding 10+ seconds of response time to the server, all day every day! A simple solution meant that we were able to remove the plugin and the site performance was immediately back with our acceptable metrics.

New Relic APM – WordPress Performance Summary
With so many factors at play on a WordPress site it is a very important to monitor performance and the best tool we have in our kit is New Relic APM, hands down. This is combined with our two dedicated servers managed by WP Engine. This allows us to provide our clients with a premium service as a part of our Premium WordPress Care Plans. Get in touch to find out how we can help you.
